Abstract
Background and aims: Patients with primary Sjögren’s Syndrome (PSS) suffer from xerostomia, or dry mouth, which has been associated with oral/teeth disease and can compromise food intake, nutritional status, and quality of life (QoL).
Materials and methods: Cross-sectional study by mail of questionnaires with European League Against Rheumatism (EULAR) Sjögren’s Syndrome Patient Reported Index (ESSPRI), Xerostomia Quality of Life Scale (XeQoLS), Primary Sjögren’s Syndrome Quality of Life (PSS-QoL), food restrictions, and nutritional status questions, to the authors’ patients with PSS, sicca, and systemic lupus erythematosus (SLE).
Results: A total of 46 patients responded: 19 patients with PSS, 13 with Sicca, and 14 with SLE. Patients with sicca were older. Patients with PSS and sicca had a higher ESSPRI dryness score. XeQoLs was higher in patients with PSS and sicca, but was similar in PSS-QoL. There was non-significant food restriction, higher in patients with PSS for sugary foods (58.0% versus 47.0% versus 36.0%; p=0.4), sticky foods (58.0% versus 54.0% versus 29.0%; p=0.2), meat/fish (26.0% versus 15.0% versus 0.0%; p=0.1), acidic beverages (63.0% versus 62.0% versus 29.0%; p=0.1) and dairy (47.0% versus 23.0% versus 29.0%; p=0.3). Average weight and BMI were similar, with higher prevalence in patients with sicca and SLE who are underweight (0.0% versus 7.7% versus 7.7%; p=0.5), and lower prevalence in patients with sicca and obesity (33.0% versus 7.7% versus 36.0%; p=0.1). Malnutrition Universal Screening Tool (MUST) score showed non-significant higher at-risk status for patients with PSS (42.0% versus 23.0% versus 21.0%; p=0.6).
Conclusion: Patients with PSS had lower xerostomia-related QoL, but similar overall QoL between groups. Reduction in food intake was higher in patients with PSS, and may be related to symptom management, but might lead to nutritional mistakes. A greater proportion of patients with PSS were overweight, but nutritional risk is still high. The authors’ main issue is the small sample size.
Key Points
1. Xerostomia impacts food choice for patients with primary Sjögren’s syndrome (PSS).
2. Quality of life related to xerostomia is lower in patients with PSS compared to those with systemic lupus erythematosus.
3. Nutritional status and risk should be part of the evaluation of patients with PSS, as well as nutritional advice.
INTRODUCTION
Primary Sjögren’s Syndrome (PSS) is a systemic autoimmune disease characterised by lymphocytic infiltration of exocrine glands and clinically by the presence of sicca symptoms, inflammation of glands (mainly salivary and eye), and auto-antibodies.1,2 Classification criteria have been proposed and take into account serology, histology of salivary glands, and functional tests of xerostomia and dry eyes.1,3,4 Two scores, the European League Against Rheumatism (EULAR) Sjögren’s Syndrome Disease Activity Index (ESSDAI) and EULAR Sjögren’s Syndrome Patient Reported Outcome (ESSPRI), have been validated to assess disease activity and symptom burden, respectively, in PSS.5,6
Sicca symptoms such as xerostomia result from inflammation and inflammatory destruction of the glands. Mouth dryness affects oral health, with mouth and teeth disease, halitosis, and teeth loss, caused by dryness, change on the flora, and infections.7 Xerostomia can also be aggravated by certain foods that are acidic, spicy, or dry.8 Frail oral health, together with dryness, has been shown in a small cohort to have a vast impact on the patients’ dietary habits.9-11
Salivary disfunction and oral health in PSS has been associated with lower quality of life, associating with salivary flow rate.12-15
However, there is still a gap in knowledge in the impact of xerostomia, oral health, and dietary habits in nutritional status and risk, and in the patient’s quality of life (QoL). The aim of this article is to assess the impact of dry mouth and dietary habit changes on QoL and nutritional risk in patients with PSS.
METHODS
The authors performed a cross-sectional observational study of patients with PSS followed in the Autoimmune Disease Unit, Unidade de Doenças Autoimunes, Hospital Curry Cabral, Centro Hospitalar Universitário Lisboa Central, Portugal. The authors applied a questionnaire that included patient-reported symptoms using ESSPRI; oral dryness impact in QoL using XeQoLS; QoL in patients with PSS using PSS-QoL; and food intake and nutritional status.
The questionnaire was sent by mail, to be filled in by the patients, together with a presentation letter regarding the project, and informed consent for signing, as well as an envelope for return. Letters were sent for patients followed at the authors’ unit with a diagnosis of PSS, sicca symptoms not fulfilling PSS diagnostic criteria (a positive controls of xerostomia), and those with systemic lupus erythematous (SLE), excluding those with secondary Sjögren’s Syndrome (as controls).
After receiving the patients’ questionnaire responses, the authors collected information on demographics and disease activity for each patient from electronic medical records. Nutritional status will be inferred by the Malnutrition Universal Screening Tool (MUST) score, performed through the nutritional status questionnaire answers.
The project was submitted to and approved by the Hospital Ethics Committee, and has maintained anonymity of participants.
Statistical Analysis
Sample size calculation yielded 80 participants, assuming a 5% margin error and 95% confidence interval, for a population of about 100 patients. Data was analysed by comparing the three different groups. Parametric data was expressed as mean (standard error of the mean), and non-parametric data as median (interquartile range). The authors performed a Student’s t-test, Wilcoxon signed-rank test, or Analysis of Variance test for parametric data, and χ2 test for non-parametric data, and Spearman’s rank correlation coefficient for correlations. The authors performed the Bonferroni Correction if more than two groups were being compared.
Statistical analysis was performed using STATA (StataCorp LP, Stata Statistical Software: Release 14, College Station, Texas, USA). A p value of <0.05 was considered statistically significant.
RESULTS
A total of 109 patients fulfilled the criteria and were included in the study and sent letters: 30 patients with PSS, 20 with sicca syndrome, and 59 with SLE. Out of those, 46 patients responded: 19 patients with PSS, 13 patients with sicca, and 14 patients with SLE, yielding about a 40% response rate.
All patients were female, with patients with sicca being older and patients with SLE younger (62.0±10.0 versus 71.0±10.0 versus 55.0±9.8 years; p<0.01). Age at onset was similar between groups (46.0±11.0 versus 48.0±14.0 versus 45.0±13.0 years; p=0.1), which resulted in longer disease/symptom duration, though this was not significant (15.0±9.8 versus 23.0±10.0 versus 18.0±9.0 years; p=0.058). Regarding antibody prevalence, anti-nuclear antibodies were overall prevalent; however, anti-Sjögren’s syndrome-related antigen A autoantibodies (63.0% versus 31.0% versus 21.0%; p=0.03) and anti-Sjögren syndrome type B antigen/Lupus La (42.0% versus 7.7% versus 21.0%; p=0.08) antibodies were more prevalent in patients with PSS.
Patients with PSS fulfilled the classification criteria in the following way: 74% fulfilled the American-European Consensus Group (AECG) 2002 criteria; 16% fulfilled the American College of Rheumatology (ACR) 2012 criteria; and 63% fulfilled the ACR/EULAR 2016 criteria. ESSDAI median was 0 (0–2), with 17 as the maximum score, showing a low activity of disease overall. Patients with SLE had a 1.5 (0–5) median SLE Disease Activity Index (SLEDAI), with 28 as the maximum score.
Quality of Life
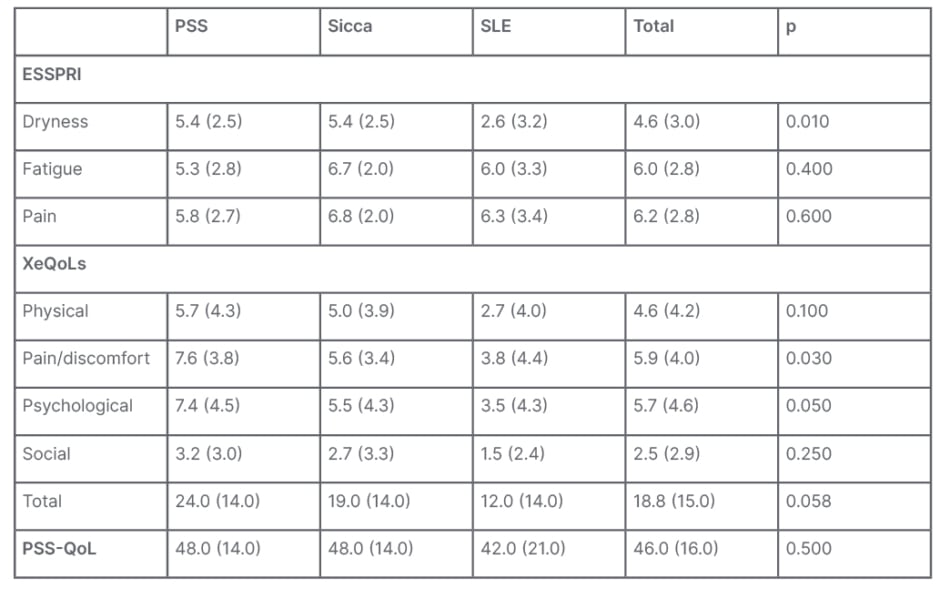
Considering patient-reported symptoms using the ESSPRI score, patients with PSS and sicca had higher dryness scores (5.4±2.5 versus 5.4±2.5 versus 2.6±3.2; p<0.01), with similar fatigue and pain scores. QoL impact of dryness evaluated by XeQoLs revealed higher scores in patients with PSS and sicca symptoms in all dominion, and, in total, although this was not always significant: physical (5.7±4.0 versus 5.0±3.9 versus 2.7±4.0; p=0.1), pain (7.6±3.8 versus 5.6±3.4 versus 3.8±4.4; p=0.03), psychological (7.4±4.5 versus 5.5±4.3 versus 3.5±4.3; p=0.05), social (3.2±3.0 versus 2.7±3.3 versus 1.5±2.4; p=0.25), and total (24.0±14.0 versus 19.0±14.0 versus 12.0±14.0; p=0.058 [Table 1]).
QoL assessed by PSS-QoL was similar between the three groups (48.0±14.0 versus 48.0±14.0 versus 42.0±21.0; p value=0.5). Dryness from the ESSPRI scale correlated with both XeQoLs and PSS-QoL with significance (p<0.001 [Table 1]).

Table 1: Patient-reported symptoms by group.
ESSPRI: European League Against Rheumatism Sjögren’s Syndrome Patient Reported Index; PSS: primary Sjögren’s syndrome; PSS-QoL: Primary Sjögren’s Syndrome Quality of Life; SLE: systemic lupus erythematosus; XeQOLS: Xerostomia Quality of Life Scale.
Dietary Intake and Nutritional Status
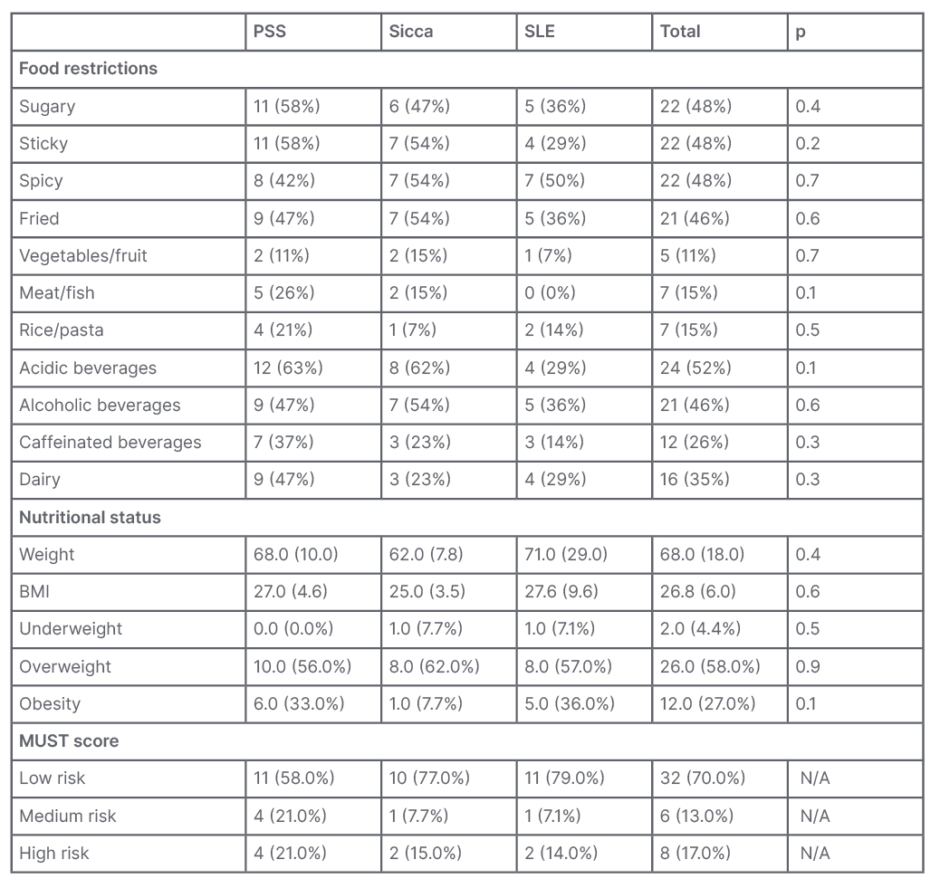
As for dietary intake, all patients reported some degree of reduction of intake due to their condition/symptoms. The most frequent were acidic beverages (52%); sugary, sticky, or spicy foods (48%); and fried food and alcoholic beverages (46%). Although there was no significant difference between the three groups, in some food categories there was a greater decrease of intake in patients with PSS and sicca: sugary foods (58% versus 47% versus 36%; p=0.4); sticky foods (58% versus 54% versus 29%; p=0.2); meat/fish (26% versus 15% versus 0%; p=0.1); acidic beverages (63% versus 62% versus 29%; p=0.1); and dairy (47% versus 23% versus 29%; p=0.3 [Table 2]).
Self-reported data of height and weight showed similar average weight in the groups (68.0±10.0 versus 62.0±7.8 versus 71.0±29.0; p=0.4) and BMI (27.0±4.6 versus 25.0±3.5 versus 27.6±9.6; p=0.5). Although not significant, there were some differences in BMI category: higher prevalence in patients with sicca and SLE who were underweight (0.0% versus 7.7% versus 7.7%; p=0.5), and lower prevalence in patients with sicca in obesity (33.0% versus 7.7% versus 36.0%; p=0.1 [Table 2]).
MUST score was calculated by using the patients’ BMI, percentage of recent weight loss, concomitant presence of acute illness, and reduction of food intake. Most patients were on the low-risk strata (58.0% versus 77.0% versus 79.0%); however, more patients with PSS were at risk, either medium (21.0% versus 7.7% versus 7.1%) or high (21.0% versus 15.0% versus 14.0%), even if not significantly (p=0.6 [Table 2]).

Table 2: Food intake restrictions and nutritional status.
MUST: Malnutrition Universal Screening Tool; N/A: not applicable; PSS: primary Sjögren’s syndrome; SLE: systemic lupus erythematosus.
DISCUSSION
The authors’ sample, despite its small size, was overall representative of the population with Sjögren’s syndrome in its demographics. The group with sicca symptoms is suggestive that sicca symptoms might be age-related rather than autoimmune in nature. As always, classification criteria raise discussion as they do not seem to be optimal in specificity and sensitivity for all patients, suggesting some patients in the sicca group may have PSS, even though they do not fully fulfill any of the classification criteria.
The authors’ cohort, as with most patients with PSS, has a very low disease activity score, with complaints being most related to dryness and fatigue symptoms. This idea was further confirmed by the ESSPRI score results. It was interesting to observe that both pain and fatigue domains were similar between the three groups: patients with sicca, being older, will experience pain and fatigue related to degenerative conditions, and muscular pain, articular pain, and fatigue can be an important feature in SLE. As expected, dryness score was higher in patients with PSS, but also patients with sicca (the authors’ positive control for dryness), and lower in patients with SLE, after excluding those with secondary Sjögren’s syndrome.
Patients with PSS had higher XeQoLS scores, which corresponds to a lower QoL compared to both patients with sicca and SLE. The domains with greatest impact of xerostomia on QoL were pain and psychological, which may give clues on approaches to improve QoL. It is interesting to observe that patients with sicca have worse xerostomia-related QoL than patients with SLE, but still better than patients with PSS. However, when QoL was assessed directly with PSS-QoL, all groups were similar, which may relate to overall poor QoL in these three groups, but also the lack of specificity of this questionnaire. Interestingly, both questionnaires correlated with dryness from ESSPRI, showing the importance of symptom control for patients’ wellbeing.
All groups had some reduction of food intake related to their symptoms, and although not significant, some food categories were more frequent in patients with PSS. Some of these food restrictions are beneficial and recommended for symptom control, since some foods (acidic, spicy, and fried) worsen xerostomia, or may aggravate oral health (sugary food). The authors observed such a pattern from patients with PSS. However, other food restrictions are not recommended in symptom control and may contribute to risk of malnutrition, such as meat/fish and dairy restriction. These observations show the importance of patient health education, with dietary and even cooking suggestions to ensure correct and balanced feeding, while also contributing to symptom control and patient satisfaction.
Regarding nutritional status, there was not a single patient with PSS in the underweight BMI category; however, there was a higher prevalence in the obesity category. Patients with obesity, although usually known by its over-nutritional status, often have malnutrition features such as sarcopenia and micro-nutrient deficits, which are overlooked and potentially health hazards. Remarkably, 42% of patients with PSS were at risk, compared to 23% and 21% from the sicca and SLE group, respectively, which should raise a red flag.
Comparing these results to a similar study with 25 patients of the Sjögren’s Newcastle cohort, the group had larger percentages of restriction in foods that worsen the symptoms, such as acidic, spicy, and sugary.9 This probably reflects the patient health education programmes at this institution. However, patients had similar restriction of meat/fish. Average BMI was similar; however, the Newcastle cohort had a higher prevalence of overweight patients (70% versus 56%), which can be representative of obesity differences between countries. Also contrasting was the nutritional risk of 42% in the authors’ cohort, versus 18% in the Newcastle cohort.
The authors’ work had several issues. The main one is the small sample size, lower than sample size calculations, which compromised results and conclusions. It resulted both from initial small cohorts, but also from the method of applying the questionnaire with a 40% response rate. Even though a 40% response rate is high for questionnaire standards, the authors could have increased it by personally applying the questionnaires in clinic appointments. The sample size could also be increased by adding other centres to the cohort. Another issue was that weight and height data was self-reported, which could have included several errors and may contribute to report bias. Furthermore, nutritional assessment without personal evaluation is very lacking and, in the future, should include bioimpedance and laboratory analysis.


