Treating the inflammation of rheumatoid arthritis (RA) early leads to less disability and improved patient outcomes.1 However, only 30–70% of patients will have a good response to the first biologic drug tried,2 and currently there is no way to predict which drug will be effective in each individual patient. We hypothesise that the RA immunophenotype will be informative in selecting the treatment most likely to be effective first time around. Cytometry using time-of-flight mass spectrometry (CyTOF) greatly increases the number of markers measurable on single cells and will allow much deeper phenotyping of the proteome along with fewer compensation issues as is inherent with fluorescent (flow) cytometry. Simultaneously, advances in non-biased clustering algorithms and their accessibility has allowed multidimensional datasets to be analysed much more comprehensively.
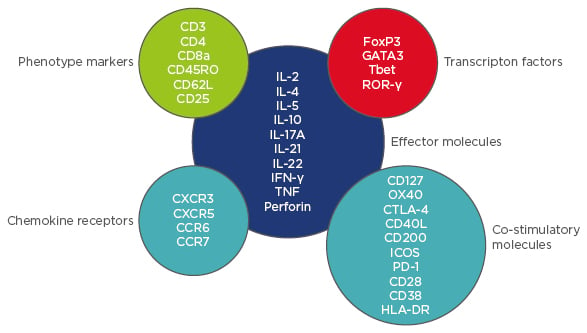
This project optimised a CyTOF T cell panel and tested a novel non-biased clustering algorithm against conventional biaxial gating. Ten healthy controls (HC) and 10 RA patients were included. T cells were stimulated for 4 hours using anti-CD3/anti-CD28 beads, then stained with a 37-channel mass cytometry panel including surface markers, intracellular antigens, and transcription factors (Figure 1). Analysis was performed by biaxial gating and by cluster identification, characterisation, and regression (CITRUS).3 The CITRUS algorithm compared the two groups: stimulated HC versus stimulated RA T cells. To compare abundances of cell clusters, the predictive association model ‘Prediction Analysis for Microarrays in R’ was used with a minimum cluster size of 2.2%, five cross-validation folds, and a false discovery rate of 1%.

Figure 1: CyTOF T cell panel.
CyTOF: cytometry using time-of-flight mass spectrometry; HLA-DR: human leukocyte antigen-D related;
IFN-γ: interferon gamma; IL: interleukin; PD-1: programmed cell death protein 1; TNF: tumour necrosis factor.
Conventional gating showed that cytokine expression was highly variable within and between HC and RA samples, but no significant differences were found when comparing HC and RA samples. However, using CITRUS, we identified three clusters of cells which were significantly different in abundance between HC and RA. Cluster 1 was CD4+CD38+, had characteristics of regulatory T cells, and was less abundant in RA. Cluster 2 was CD28nullCD8+ expressing perforin and Tbet, and Cluster 3 was a CD4–CD8 CD127highCCR6+ population, both of which were more abundant in RA.
To conclude, although cytokine expression of ex vivo stimulated T cells from RA and HC is highly variable, no differences were found between the two groups with conventional gating and this may have been due to small sample numbers. Using the fully automated clustering algorithm CITRUS, differences in the abundance of three novel cell clusters between the RA and HC groups were revealed and the phenotype of these clusters ascertained. These clusters would have been missed using biaxial gating alone.
Our next step is to compare RA responders to non-responders using an automatic clustering algorithm. By doing so, novel cell clusters might be identified which differ between responders and non-responders, and may go some way to predict treatment response. Furthermore, the function of novel clusters might be further characterised by isolation using fluorescence-activated cell sorting and functional assays. Finally, although in this study biaxial gating did not reveal any significant differences, we believe that automatic clustering algorithms should be used in conjunction with conventional gating when analysing high-dimensional datasets to maximise the scientific output of the data.


