BACKGROUND AND AIMS
Staging cardiac damage in patients undergoing transcatheter aortic valve replacement (TAVR) has been proposed as a prognostic tool.1-2 Other authors have shown that these staging systems are related with mortality.1-3 The aim of this study was to perform an external validation of the predictive capacity of the staging system proposed by Généreux et al.1 for 1-year mortality; and to assess the incremental value of global longitudinal strain (GLS) and right ventricular-arterial coupling (RVAc) in the prognostic performance of this cardiac damage staging model.
MATERIALS AND METHODS
There were 496 consecutive patients with severe aortic stenosis and undergoing TAVR included in a single hospital registry. According to current guidelines, baseline echocardiography was performed before TAVR. Patients were classified into the following stages of cardiac damage:1 Stage 0: no cardiac damage; Stage 1: left ventricular (LV) damage (LV ejection fraction [LVEF]: <50%; LV mass index: >95 g/m2 for females and >115 g/m2 for males); Stage 2: left atrial or mitral valve damage (left atrial volume index: >34 mL/m2, moderate-severe mitral regurgitation, or presence of atrial fibrillation); Stage 3: pulmonary vasculature or tricuspid valve damage (systolic pulmonary artery pressure ≥60 mmHg or moderate to severe tricuspid regurgitation); and Stage 4: right ventricular damage (tricuspid annular plane systolic excursion: <1.7 cm; S’ <9.5 cm/sec). The area under the receiver operating characteristic curve was used to measure the discriminatory capacity of staging models to predict 1-year mortality risk. Logistic regression analysis was used to identify predictors of outcome.
RESULTS
Regarding baseline characteristics, the mean age of the cohort was 81.9±6.2 years. In this cohort, 66.9% were males; 37.5% of patients had diabetes; 62.5% of patients had hypertension; and 62.5% of patients had dyslipidemia. The mean aortic valve area was 0.86±0.60 cm2; the mean LVEF was 57.9±12.3%; the mean LV-GLS was -15.6±3.5%; and RVAc was 0.61±0.34. Logistic regression analysis showed that LVEF, LV-GLS, and RVAc were independent predictors of all cause 1-year mortality.
When classifying the cohort according to the cardiac damage staging system,1 only one patient met criteria for Stage 0. Thus, patients in Stage 0 and 1 were merged in an initial stage, which included 39 patients (7.9%). Regarding the rest of the sample, 159 (32.1%) patients were in Stage 2,157 (31.7%) patients were in Stage 3, and 141 (28.4%) patients were in Stage 4.
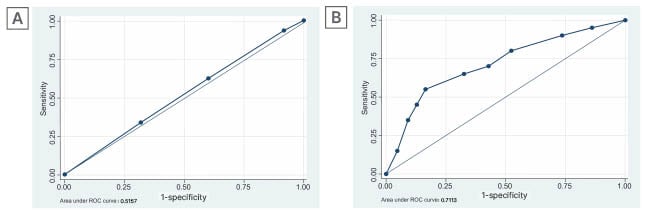
The area under the receiver operating characteristic curve was used to predict all-cause 1-year mortality. In the authors’ cohort the staging was 0.516 (confidence interval [CI]: 0.449–0.582). The best cut-off value for LV-GLS to predict 1-year mortality was -14% with an area under the curve (AUC) of 0.634 (CI: 0.487–0.781) and for RVAc it was 0.35, with an AUC of 0.748 (CI: 0.638–0.858). By adding GLS and RVAc to the staging system, the AUC improves to 0.711 (CI: 0.584-0.839 [hl]Figure 1[/hl]).

Figure 1: Area under the receiver operating characteristic curve for 1-year mortality.
A) Cardiac damage staging system and B) cardiac damage staging system after adding GLS and RVAc.
Adapted from Généreux et al.1
GLS: global longitudinal strain; ROC: receiver operating characteristic; RVAc: right ventricular-arterial coupling.
CONCLUSION
In conclusion, cardiac damage staging might have a fundamental role in patient selection and in the clinical outcome for patients after TAVR. However, the addition of feasible and widely available echocardiography parameters such as LV-GLS and RVAc can significantly increase its prognostic yield.


