BACKGROUND AND AIMS
Platanus pollen is an important cause of allergy in many cities of western Europe, where this pollen is produced by the plane tree, Platanus orientalis L. var. acerifolia Dyand (Aiton), which is widely used as an ornamental species in parks, gardens, and other urban green areas,1 favouring human exposure to its pollen. Its major allergen Pla a 1 is recognised by up to 92% of monosensitised Platanus allergic patients and 83% of polysensitised patients, allergic to this pollen type, present 60% of IgE to its major allergen Pla a 1.2 In this study, the authors studied this pollen type and the allergen Pla a 1 in the year 2018 in the atmosphere of Évora, Portugal. The aim was to analyse the aerobiological characteristics of the Platanus pollen and to study the relationship between the airborne concentration pollen and the major allergen Pla a 1. Furthermore, the influence of meteorological variables on the airborne concentration of this pollen type was investigated.
MATERIALS AND METHODS
Pollen and allergen sampling were performed using a Hirst-type spore trap (Lanzoni S.r.l., Bologna, Italy) and a high-volume cascade impactor ChemVol® (Butraco, Son, the Netherlands), respectively. Pollen was analysed following the procedure established by the European Aerobiology Society (EAS) and following the approach recommended in Galan et al.3 Allergens were quantified using a specific ELISA method.4 The main pollen season was calculated as 95.0% of total annual pollen, obtained after removing 2.5% of the start and end of total annual pollen integral.5 Meteorological data were obtained from the Atmospheric Sciences Observatory (ICT), University Évora, Évora, Portugal.
RESULTS
The results indicate that the main pollen season of the Platanus pollen took place from March 28th to April 20th. The maximum concentration was recorded on April 1st with 619 pollen grains/m3. There were 16 days of allergy risk (>50 pollen grains/m3) for people with allergies, of which seven were considered as high-risk level (>200 pollen grains/m3).6 Regarding Pla a 1, the temporal profile coincided and a significant relationship between the concentration of airborne pollen and allergen was found (Spearman’s R=0.632; p<0.01). The mean pollen potency7 was 14.4±7.7 pg allergen/pollen.
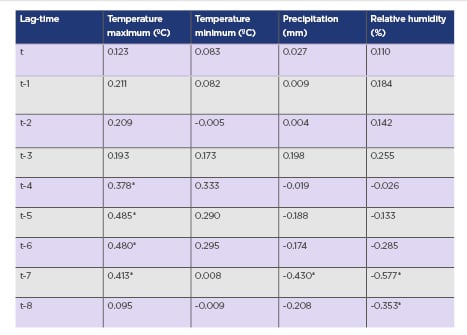
The temperature, precipitation, and relative humidity (RH) were the meteorological variables that most influenced the airborne Platanus pollen in Évora; maximum temperature occurring 4–7 days prior to pollen release positively influenced pollen loads, while precipitation and RH, particularly 7–8 days prior to pollen release, had a negative influence (Table 1).

Table 1: Spearman´s correlation analysis between pollen and meteorological variables considering different time lags.
Lag-time is the number of days before the current day (t).
*p<0.05
CONCLUSION
In summary, these results show that the allergenic load (Pla a 1) coincides with the presence and magnitude of the pollen concentration in the atmosphere. Only the meteorological conditions during 4–8 days prior to pollen release were significant, suggesting that the environmental conditions during the pollen maturation process in the anthers are key factors involved in the Platanus pollen and allergen emissions and, thus human exposure to its allergens. Finally, the results suggest that pollen counts are good indicators of the allergenic loads in the atmosphere and, together with meteorological conditions, are useful to design allergen forecasts and alert systems for the allergic population.


