Abstract
Purpose: This study aims to evaluate changes in retinal microvasculature in patients with multiple sclerosis (MS) by means of optic coherence tomography angiography (OCTA).
Material and Methods: A total of 60 patients with MS (18 clinically isolated syndrome [CIS], 27 relapsing remitting MS [RRMS], 15 secondary progressive MS [SPMS]) and 56 healthy controls participated in the study. Demographic and clinical data, including optic neuritis history, ophthalmic examination findings, and OCTA parameters, were recorded. OCTA parameters included the following vascular structures: vascular density (VD) in the retinal superficial capillary plexus, deep capillary plexus, and radial peripapillary capillaries. Retinal nerve fiber layer as a structural spectral domain optic coherence tomography parameter was also evaluated.
Results: Superficial and peripapillary vascular plexus densities and retinal nerve fiber layer thickness values were significantly reduced in patients with MS (p=0.0001). Deep capillary plexus densities showed no difference between groups (p=0.279). Patients with a previous history of optic neuritis (ON+) showed significant reduction in VD, compared to patients without a previous history of optic neuritis (ON-), and control groups (p=0.0001). The SPMS group had lower perifoveal values than patients with RRMS and CIS, and patients with RRMS had lower levels than the CIS group (p=0.012; p=0.03; p=0.035). Expanded disability status scores and VD values inversely correlated (r=-0.264; p=0.003). No significant difference between MS and control groups in the foveal avascular zone was found (p=0.296).
Conclusion: OCTA findings showed reduced peripapillary and superficial vascular plexus densities in patients with MS. While this reduction was more prominent in patients with SPMS and history of optic neuritis, patients with CIS and without history of optic neuritis still showed significant reduction compared to healthy controls. These results indicate vascular regression caused by reduced metabolic demand, and microvascular damage caused by chronic inflammation.
Key Points
1. This study uses optic coherence tomography angiography (OCTA) to assess retinal microvasculature in multiple sclerosis (MS), providing insights into neuroinflammation and hypoperfusion in optic nerve involvement in different disease stages.
2. OCTA reveals significant reductions in vascular parameters in patients with MS, including those without optic neuritis history. Prognostically, these changes correlate with disability scores, emphasizing OCTA’s potential.
3. OCTA is emerging as a valuable tool, revealing vascular changes that correlate with clinical parameters, which may provide insight for prognosis and treatment decisions.
INTRODUCTION
Multiple sclerosis (MS) is an autoimmune disease that occurs mostly in females, typically in young adults aged between 20–30 years, and is characterized by central nervous system inflammation, demyelination, and axonal damage. The prevalence of MS ranges from 5–300/100,000 worldwide.1 Clinical presentation may vary depending on the location of central nervous system lesions, with the most common symptoms being weakness in the extremities, sensory deficits, ataxia, dysarthria, visual deficits, and fatigue. Optic neuritis (ON) is reported as the initial symptom in 15–20% of patients with MS, and up to 70% of patients with MS are affected by ON during their lifetime.2,3
Optic nerve involvement without a clinical ON history has been demonstrated in patients with MS through the visual evoked potential and post-mortem studies.4 Optic coherence tomography (OCT) has been increasingly used in clinical practice, as peripapillary retinal nerve fiber layer (RNFL) thickness correlates with visual acuity, visual field, and contrast sensitivity.5 Additionally, studies have shown that it correlates with disease duration, clinical course, disability, and MRI findings, such as thalamus and brain parenchymal volume, and development of contrast-enhancing lesions.6
Optical coherence tomography angiography (OCTA) is a state-of-the-art imaging technique that measures retinal vascular densities via sequential OCT scans of a particular retinal area, where motion contrast of the erythrocytes within the vessel provides detailed visualization of retinal and choroidal vasculature, without the use of contrasting agents.7 A thorough assessment of the microvascular network in MS holds promise in detecting early optic involvement without retinal atrophy, and understanding the role of hypoperfusion in the pathogenesis of ON.
This study aims to assess variations in retinal microvasculature among individuals with MS by examining OCTA parameters across three distinct clinical groups: clinically isolated syndrome (CIS), relapsing-remitting MS (RRMS), and secondary progressive MS (SPMS). The authors hypothesize that the observed changes in retinal microvasculature are indicative of neuroinflammation, a hallmark of MS progression.
METHODS
Patient Cohort
This study was carried out at the University of Health Sciences Haseki Research and Training Hospital, Istanbul, Türkiye, in accordance with the principles of the Declaration of Helsinki. The procedure was approved by the Clinical Research Ethics Committee, and all participants gave written informed consent after detailed explanation of the nature of the study. From March 2020–March 2021, the authors recruited 60 patients with MS, and 56 healthy controls.
For this study, the authors recruited patients with MS aged between 18–55 years, with no other neurological or psychiatric diagnosis. The authors used the 2017 McDonald criteria for MS diagnosis. The exclusion criteria were history of MS relapse 6 months prior and after recruitment, the use of corticosteroids within the last 30 days, the presence of systemic diseases that may confound the assessment (such as hypertension, diabetes, and ischemic heart disease), glaucoma (intraocular pressure >21 mm Hg), refractive error >+3/-7 diopters, and any retinal or optic disc disease. The authors ensured that each patient in the MS group was sex- and age-matched with a healthy control.
The authors enrolled 60 patients with MS (120 eyes) and 56 healthy participants (107 eyes) for this study. Five eyes were excluded from the analysis due to the presence of drusen, visual loss resulting from amblyopia sequelae, and traumatic ON.
Clinical Data
The authors collected clinical data, such as age, sex, MS subtype, disease duration, Expanded Disability Status Scores (EDSS), history of ON, medication use, and cerebrospinal fluid findings (presence of oligoclonal bands and IgG index, if available). The EDSS assessment was carried out by a neurologist certified at level C, the highest score for EDSS certification. The authors also recorded the demographic characteristics of the control group.
Optical Coherence Tomography Angiography Data Acquisition Protocol
The ophthalmological examination comprised of the best-corrected visual acuity expressed as a decimal value; intraocular pressure measurement; fundus examination after pupil dilatation was done to exclude conditions mentioned in the exclusion criteria; and OCTA results obtained using the Optovue Angiovue System, software ReVue XR version 2017.1.0.151 (Optovue Inc., Fremont, California, USA).
The OCTA analysis, based on a split spectrum amplitude decorrelation algorithm,8 divided the macular region into the whole image, fovea, and parafovea in each vascular network of the retina.9 Retinal vascular density (VD), the percentage of the imaging region occupied by blood vessels, was divided into two vascular plexuses (superficial capillary plexus [SCP] and deep capillary plexus [DCP]) from the macular 6×6 mm2 OCTA images. The foveal avascular zone (FAZ) was estimated from the macular 3×3 mm2 OCTA images and determined in micrometers. A signal strength index and composite quality index (QI) were used to assess image quality.9 The QI had a range of 1–10 and accounted for signal strength, as well as motion artifacts and image sharpness. The scans were repeated if signal strength index or QI was <7/10. The upper limit for evaluating the superficial plexus was set as the internal limiting membrane, and the lower limit was set as 9 μm below the inner plexiform layer (IPL). To evaluate the deep plexus, 9 μm below the IPL, and 9 μm above the outer plexiform layer were taken (Figure 1). Using the same software, the RNFL thickness was calculated along a 3.45 mm diameter circle around the optic disc. Measurements of the disc and the rim areas, as well as the cup-to-disc ratio, were used.
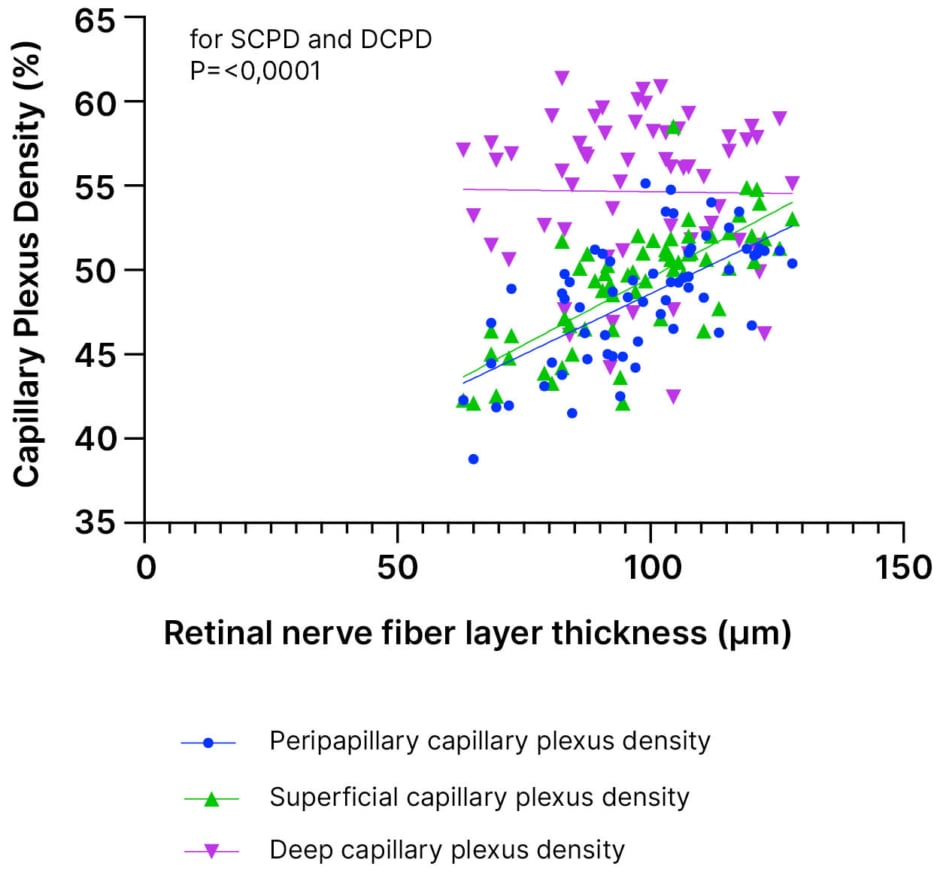
Figure 1: Retinal nerve fiber layer thickness and capillary plexus density percentages.
DCPD: deep capillary plexus density; SCPD: superficial capillary plexus density.
Statistical Analysis
The authors performed statistical analyses using the Number Cruncher Statistical System (NCSS) 2007 statistical package program (NCSS, LLC, Kaysville, Utah, USA). They examined the distribution of variables such as mean, standard deviation, median, and interquartile range. The Shapiro–Wilk test determined the normality. For normally distributed variables, the authors used a one-way analysis of variance (ANOVA) for intergroup comparisons, Tukey multiple comparison tests for group comparisons, and an independent t test for paired group comparisons. Non-normally distributed variables underwent Kruskal–Wallis and the Mann–Whitney U test for intergroup and paired comparisons, respectively. The authors used the χ2 test to compare qualitative data. The Pearson correlation test was used to determine the relationship between variables. For the comparison of MS subtypes, the restricted maximum likelihood method for mixed effect regression analysis was done with the Statistical Package for the Social Sciences (SPSS) Statistics 25 (IBM, Armonk, New York, USA). The significance level for all tests was determined at p<0.05.
RESULTS
There were 120 eyes from 60 patients in the MS group (mean age: 35.74±9.99; 23 male; 37 female), and 107 eyes from 56 healthy subjects in the control group (mean age: 34.78±10.93; 32 female; 24 male). Demographic and clinical characteristics are detailed in Table 1. After analyzing the data from the patient cohort, the authors aimed to evaluate the variations in retinal microvasculature among patients with MS, and the authors’ hypothesis posited that the decrease in vascular parameters would be more prominent in progressed disease states.
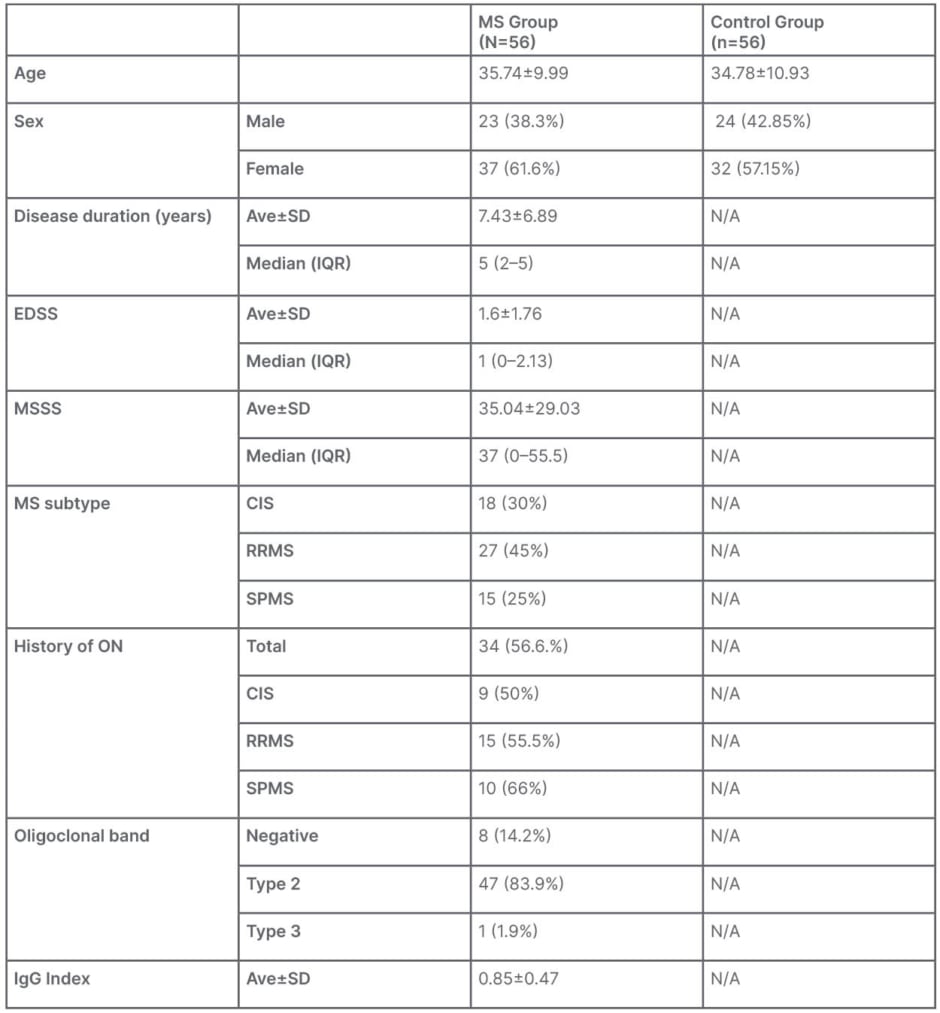
Table 1: Demographic and clinical data.
Ave: average; CIS: clinically isolated syndrome; EDSS: Expanded Disability Status Score; IQR: interquartile range; MS: multiple sclerosis; MSSS: MS Severity Score; N/A: not applicable; ON: optic neuritis; RRMS: relapse remitting MS; SD: standard deviation; SPMS: secondary progressive MS.
Retinal fiber layer thickness, and all retinal vascular parameters, except for the peripapillary capillary density inside the disc, and the densities of the deep vascular plexus, were significantly lower in the MS group (Table 2). Notably, the mean perifoveal nasal density of the DCP in the MS group was statistically significantly higher than that in the control group (p=0.029).
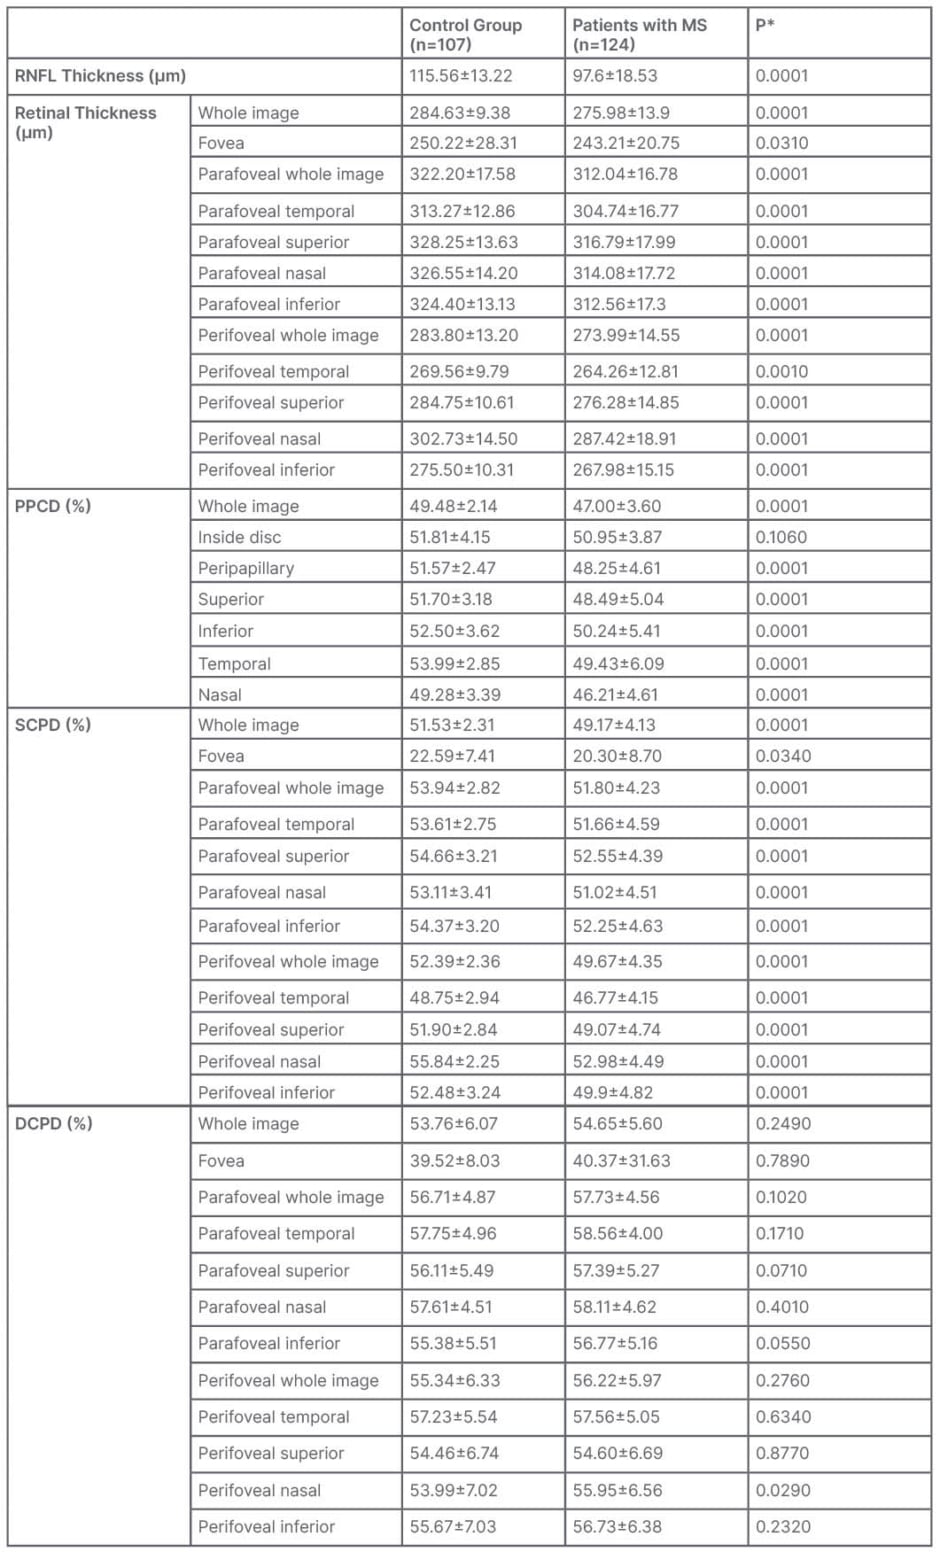
Table 2: Vascular parameters in the multiple sclerosis and control group.
*Independent t test.
DCPD: deep capillary plexus density; MS: multiple sclerosis; PPCD: peripapillary capillary density; RNFL: retinal nerve fibre layer; SCPD: superficial capillary plexus density.
The mean thickness of the RNFL in the study group was significantly lower compared to that in the control group (p=0.0001). When analyzing the relationship between RNFL thickness and vascular densities in the MS group, a positive correlation was observed between the densities of the peripapillary and SCPs (p<0.0001; r=0.4193; r=0.5455; Figure 1). However, no correlation was found between the densities of the DCP (p=0.914).
Although no statistically significant correlation was found between disease duration and the mean density of the SCP (SCPD), a negative tendency was observed (r=0.03090; p=0.1717).
There was a significant difference in all optic nerve head and retinal vascular parameters (p=0.0001) between the ON+, ON-, and control groups, except for foveal retinal thickness, and values of the density of the deep vascular plexus (Table 3). When comparing these groups individually, the parameters were lower in the ON+ group than in the ON- group (p=0.0001), and lower in the ON- group than in the control group (p=0.0001). No statistically significant difference was observed between the mean size of the FAZ of the control and study groups (p=0.296).
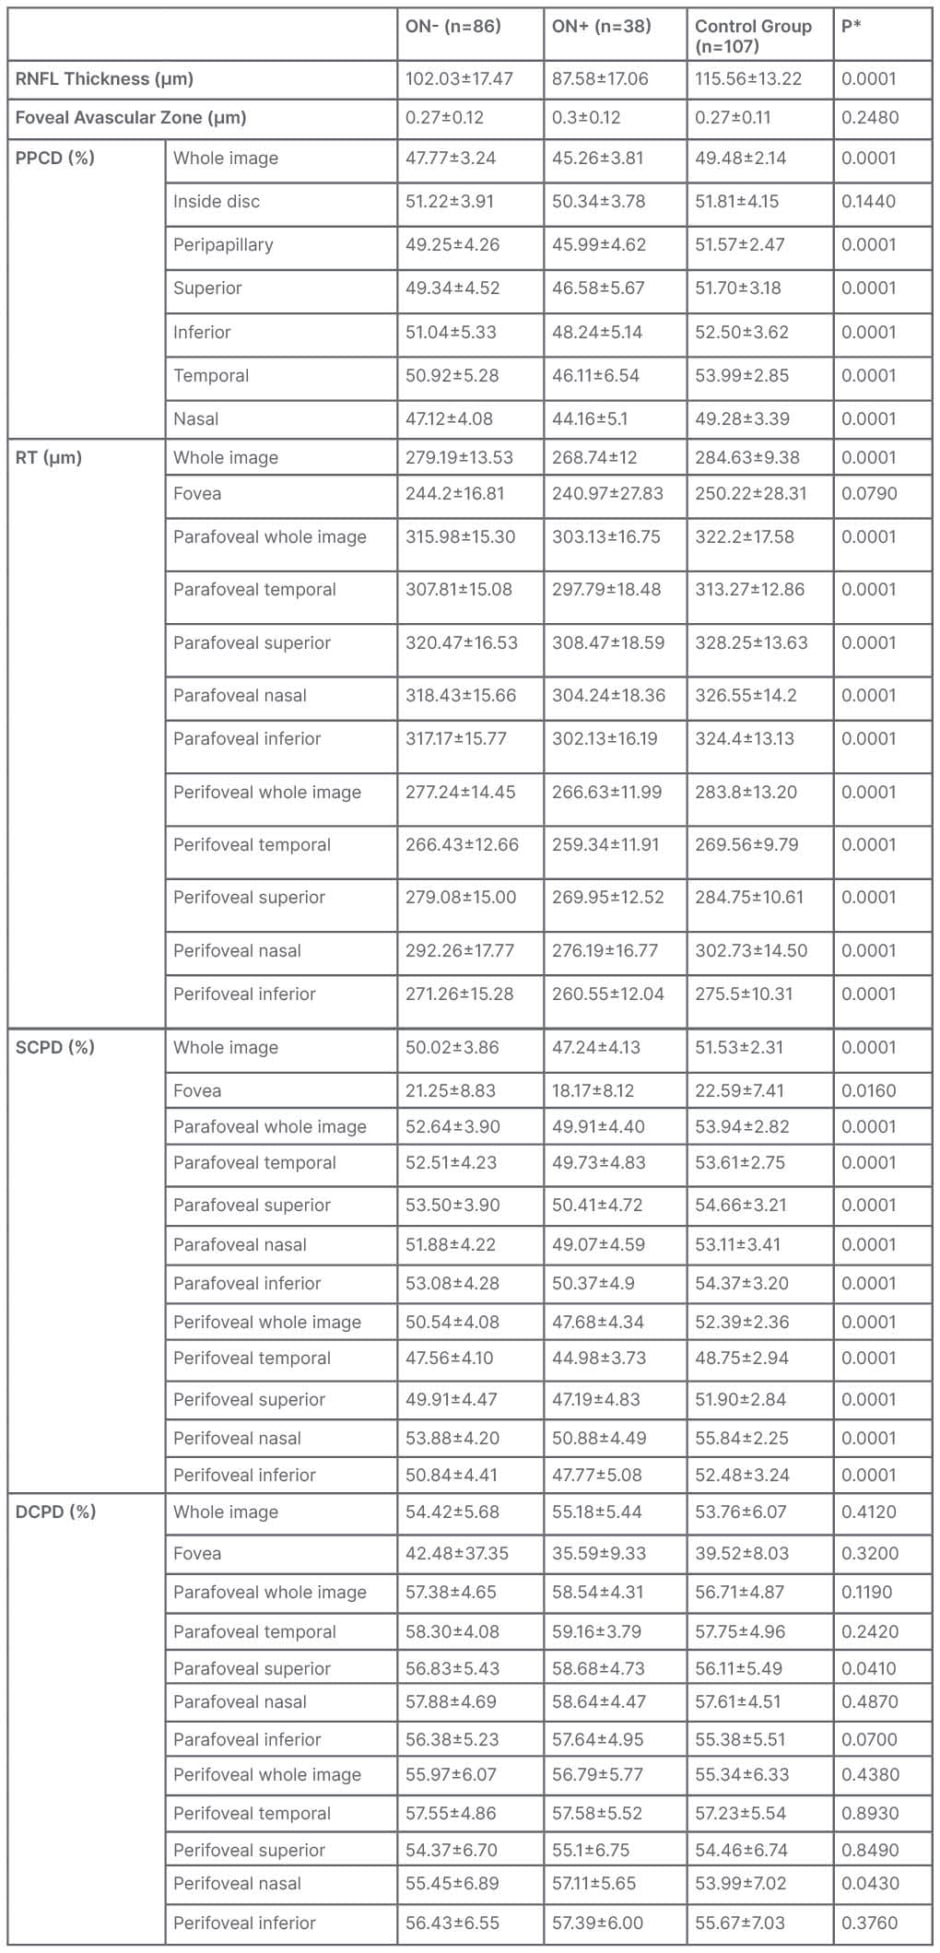
Table 3: Vascular parameters according to history of optic neuritis.
*One way analysis of variance.
DCPD: deep capillary plexus density; ON-: patients with no history of optic neuritis; ON+: patients with history of optic neuritis; PPCD: peripapillary capillary density; RNFL: retinal nerve fiber layer; RT: retinal thickness; SCPD: superficial capillary plexus density.
The comparison between different MS subtypes showed statistical significance in whole vascular density of the SCP, as well as superior and inferior hemispheres, in which SPMS eyes had lower densities (p=0.019; p=0.026; p=0.019). The same correlation was found in perifoveal SCP values (p=0.028; p=0.038; p=0.027), while no statistically significant difference was found in parafoveal SCP and DCP parameters.
When examining the correlation between SCPD and EDSS, no correlation was observed in ON+ eyes. However, significant but weak negative correlations were found for ON- eyes between the whole image, perifoveal, and parafoveal SCPD, and EDSS (r=0.1003 and p=0.0031 for whole image SCPD; r=0.1103 and p=0.0019 for perifoveal SCPD; r=0.1026 and p=0.028 for parafoveal SCPD).
A statistically significant negative correlation was observed between the EDSS score and values of RNFL, as well as retinal thickness (r=-0.288; p=0.001; r=-0.264; p=0.003). A similar negative correlation was observed with values of superficial parafoveal and perifoveal vascular plexus densities (r=-0.221; p=0.014; r=-0.188; p=0.036). However, no statistically significant correlation was observed for the values of DCPD (p>0.05). EDSS and MS Severity Score (MSSS) values did not correlate with the values of FAZ (r=-0.097; p=0.290; r=-0.097; p=0.290).
DISCUSSION
Retinal perfusion has been extensively researched in many neurological diseases, because the brain and retina share the same embryonic origin, and receive blood from the same vessels. ON in MS has also been extensively studied due to its high incidence rates, and the accessibility of the affected demyelinated area. Various MS studies have reported microvascular changes and global hypoperfusion, and several hypotheses, such as neurodegeneration caused by diffuse inflammation, trans-synaptic degeneration, and ischemia, have been proposed.
Several publications have reported decreased blood flow in normal-appearing white matter,10 and the observation that these changes were noted as early as in CIS highlights the potential causal connection. One theory is that releasing nitric oxide and cytokines, due to widespread inflammation or vasoconstriction caused by elevated astrocyte calcium levels, could contribute to this condition.11
Alterations in vascular structures in MS have been previously identified through various techniques before the availability of OCTA. For instance, Akarsu et al.12 used Doppler ultrasound to investigate retrobulbar hemodynamics, and discovered reduced blood flow and elevated resistance in the central retinal and posterior ciliary arteries. The authors suggested this could be due to vasospasm triggered by increased levels of endothelin-1.12
In an autopsy study of the retinas of patients with MS, Green et al.13 discovered ganglion cell loss and varying degrees of axonal damage that were not correlated with the disease severity. Moreover, damage beyond the retinal nerve fiber and ganglion cell layers has been documented, with histopathological investigations revealing changes that extend to the inner nuclear layer, a finding that OCT studies have corroborated. Because these changes are focal, they have been linked to retrograde trans-synaptic degeneration, not neurodegeneration caused by diffuse inflammation.14
The neurosensory retina receives blood from the two distinct vascular plexuses, originating from the central retinal artery. The superficial vascular plexus supplies the retinal nerve fiber and ganglion cell layers, while the deep vascular plexus supplies the outer plexiform and inner nuclear layers. The peripapillary vascular plexus, on the other hand, supplies the nerve fiber layer. Recent reviews have indicated that thinning of the RFNL and ganglion cell layer in patients with ON is accompanied by a decrease in superficial and peripapillary capillary plexus density.15-18 Vascular regression due to reduced metabolic demand, and endothelial damage caused by inflammation, have been proposed as potential causes.
Consistent with previous literature, the authors’ study revealed a reduction in RNFL thickness, and a decrease in SCPD parameters, with a positive correlation between these parameters in patients with MS. Moreover, the authors observed a decrease in mean superficial plexus density and retinal thickness in eyes with ON+ compared to those with ON- and the control group, and in ON- eyes compared to the control group. While some studies have found no significant differences between ON+ and ON- eyes, suggesting that retinal microvascular damage is a primary effect of the disease rather than a secondary change due to ON,19,20 others have reported no significant differences in superficial vascular densities between MS ON- eyes and the control group.17,18,21,22 However, consistent with the authors’ findings, some studies have also reported a decrease in mean RNFL thickness and superficial vessel densities in eyes without a history of ON compared to the control group, suggesting that microvascular damage is secondary to diffuse inflammation, and independent of demyelinating attacks.23-26
Another study that included patients with RRMS, SPMS, and primary progressive MS in more advanced stages of the disease observed a negative correlation with the EDSS scores in all eyes, regardless of a history of ON.23 Detecting damage independently of the ON history in the later stages of the disease supports the idea that it is a secondary outcome of chronic inflammation. This study also revealed a significant reduction in superficial perifoveal capillary plexus densities in the SPMS group compared to the RRMS and CIS groups, and in the RRMS group compared to the CIS group. In line with the literature, the authors also identified a negative correlation between disability scores such as EDSS and MSSS, and SCPD literature.23,25 Notably, there was no correlation between SCPD values and EDSS in ON+ eyes, whereas SCPD showed a negative correlation with EDSS in ON- eyes.
In this study, peripapillary capillary plexus density (PCPD) parameters were also found to be significantly lower in ON+ eyes compared to ON- and the control group, in four quadrants. In addition, PCPD values positively correlated with RNFL thickness. Since PCPD is associated with the retinal nerve layer, its decline in eyes without a history of ON may predict axonal loss.26 The radial peripapillary capillary network cannot be evaluated by fundus fluorescein angiography. Therefore, the findings obtained from OCTA are very important.7,27
Macular ganglion cell loss is a well-established characteristic of MS, and parafoveal VD and retinal thickness values are critical for demonstrating the loss. Lanzillo et al.28 reported, in a prospective study, that the mean parafoveal plexus density declined over time, which was linked to increased disability. In the authors’ study, they discovered that the mean parafoveal plexus density was significantly lower in the ON+ group than in the ON- group, and it was negatively correlated with EDSS and MSSS.
Since the deep vascular plexus is associated with the outer plexiform and inner nuclear layers, it is not anticipated to be affected following ON. Anatomically, the deep vascular plexus comprises the anastomoses of the superficial vascular plexus. In the event of primary vascular damage, a decrease in density is expected in both layers. However, the literature does not support this, including the authors’ study.15,25,26,29
The widening of the FAZ, and a reduction in its circularity, indicate macular ischemia. This finding is considered a marker of microvascular damage in OCTA studies, since it correlates directly with the severity of glaucoma and diabetic retinopathy, and is associated with decreased visual acuity. The lack of a significant difference in FAZ parameters in patients with MS compared to the control group contradicts the theory of precursor microvascular damage in MS.20,30 Likewise, the authors’ study revealed no significant increase in FAZ parameters.
Limitations of this study include the lack of an additional OCT evaluation, which would have allowed comparison between ganglion cell IPL and vessel densities. Furthermore, due to its cross-sectional design, this study cannot demonstrate the prognostic value of OCTA assessment. Prospective studies are required to establish the clinical usefulness of OCTA for prognosis and treatment decisions.
The most critical distinguishing aspect of the authors’ study is the inclusion of patients with CIS and SPMS in the cohort. As of writing, no publications have statistically compared OCTA parameters in patients with CIS, RRMS, and SPMS. More comprehensive prospective studies are necessary to determine the progression of vascular changes over time.
CONCLUSION
This study demonstrates a reduction in both peripapillary and SCP density, and retinal thickness values, in patients with MS, compared to the control group. This discovery was evident in all four quadrants when perifoveal and parafoveal areas were analyzed separately. However, no disparity was observed in DCP density.
A decrease in vascular parameters was observed in eyes with a previous history of ON, compared to those without. This observation may be attributed to reduced metabolic demand caused by retinal nerve layer atrophy, following a demyelinating attack. Nonetheless, the discovery of a decrease in eyes without a history of ON compared to the control group implies the presence of microvascular damage, believed to occur due to inflammation independent of the demyelinating attack.
The reduction in perifoveal VD values, along with the negative correlation between peripapillary and SCP density values, and disability scores such as EDSS and MSSS, was observed in patients with SPMS when compared to RRMS and CIS groups. These findings indicate that OCTA possesses promising prognostic value.
In conclusion, this study discovered decreased peripapillary and superficial vascular plexus densities in patients with MS using OCTA. While this decline was more significant in patients with SPMS and eyes with a history of ON, it was also evident in eyes without ON, and patients with CIS. These observations suggest a regression caused by decreased metabolic demand, and microvascular damage caused by diffuse inflammation. Furthermore, the reduced VD values were negatively associated with disability scores, indicating that OCTA may provide information on disease progression. More comprehensive studies are necessary to show the evolution of vascular damage over time.